

Nós somos um grupo de alunos do curso de Técnico Auxiliar de Saúde do 10.º ano e, no âmbito de módulos sobre tecnologia e os média, aplicámos um questionário a alunos dos 7.º e 8.º anos e 10.º de cursos profissionais. Obtivemos 65 respostas.
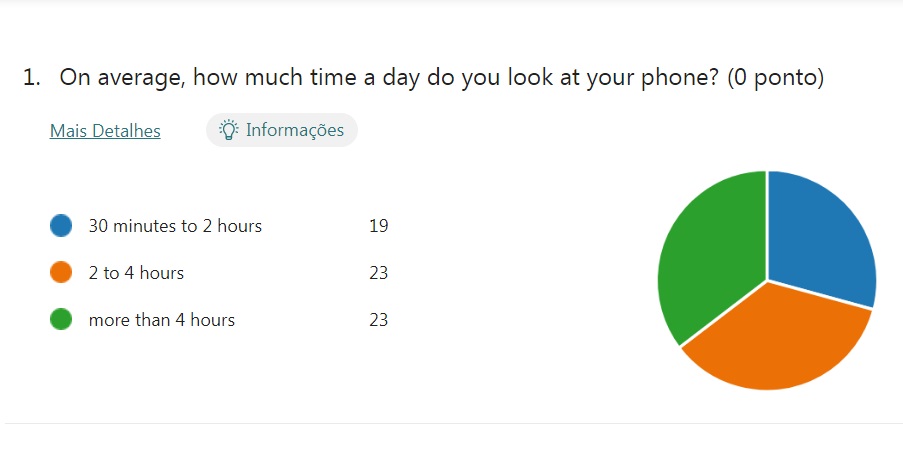
1. A primeira questão era: “Em média, quanto tempo por dia olhas para o telemóvel?”.
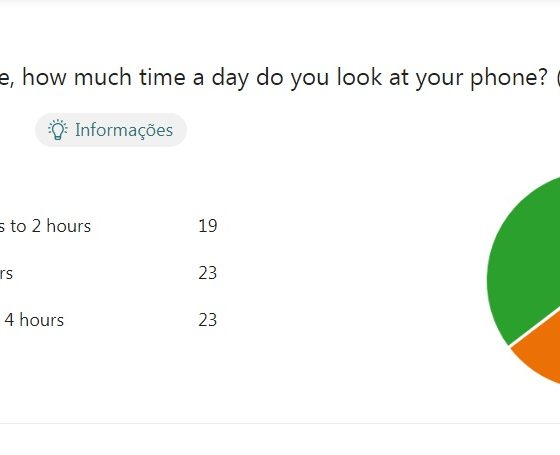
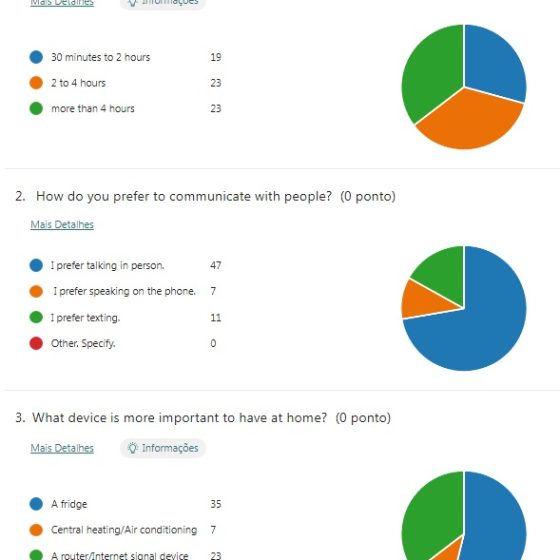
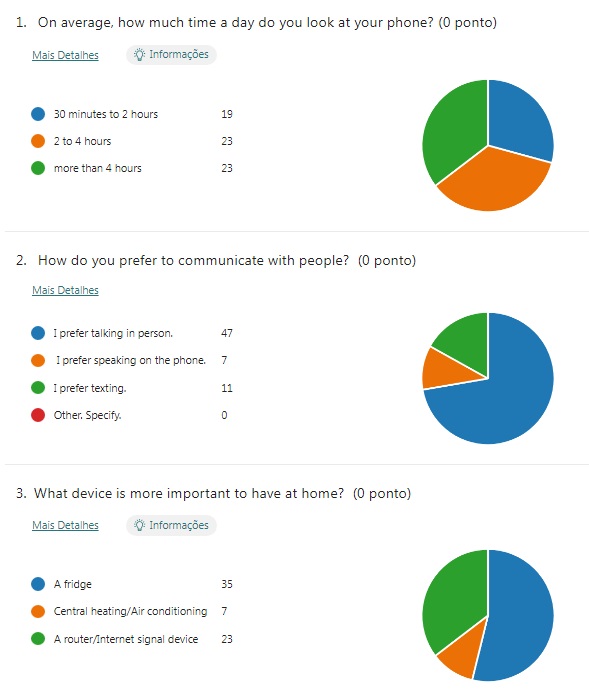
A esta questão, 23% dos inquiridos responderam 2 a 4 horas; outros 23% responderam mais de 4 horas; e 19% responderam 30 minutos a 2 horas.
João, Gonçalo, Diogo e Luca
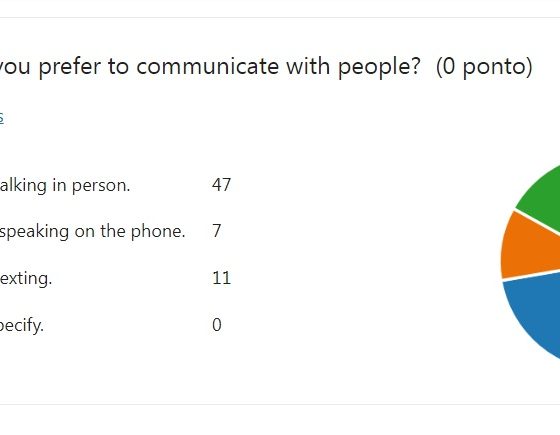
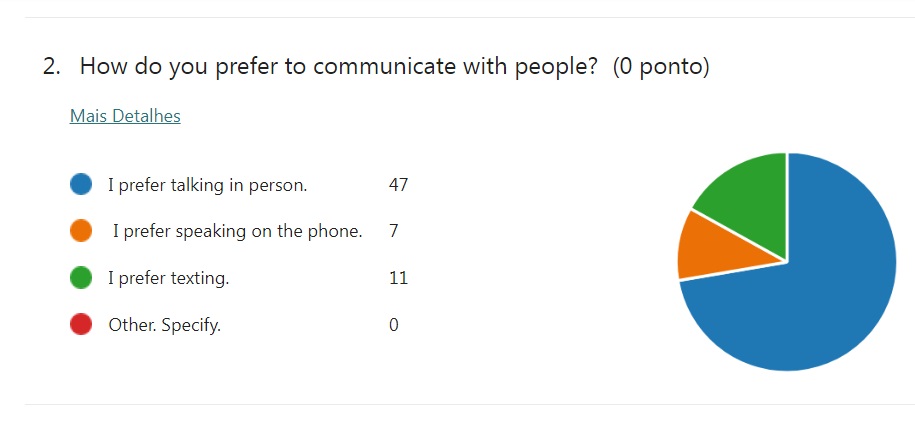
2. A segunda questão era: “Como preferes comunicar com as pessoas?”, a que 47% responderam: Prefiro conversar em pessoa; 11% responderam que preferem conversar ao telefone; e 7% responderam que preferem enviar mensagens escritas.
Andreia, Clara, Maria e Mariana
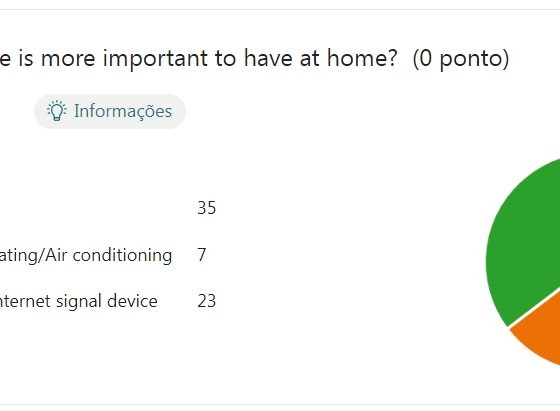
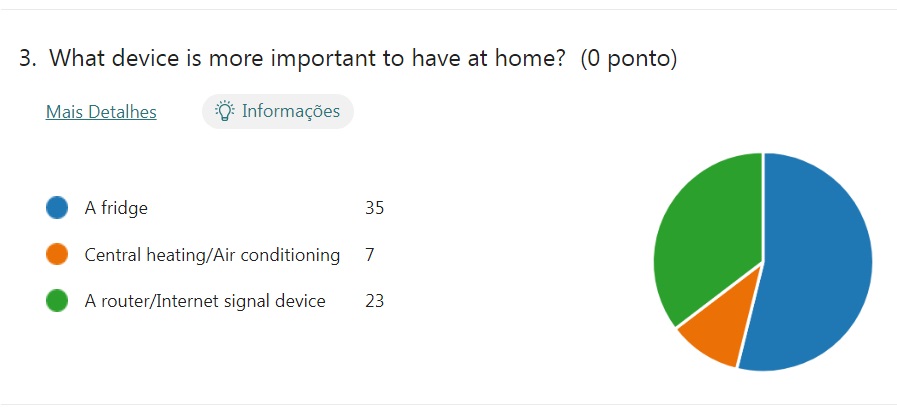
3. A terceira pergunta era: “Que aparelho é mais importante ter em casa?” A esta pergunta, 35% responderam: “Um frigorífico”; 23% responderam “Um router/sinal de internet”; e 7% responderam “Aquecimento central/Ar condicionado”.
Carolina Silva, Isabela e Leonor
Estas respostas levam-nos a crer que, em geral, os alunos passam bastante tempo focados nos seus telemóveis e valorizam o acesso à Internet. Ainda assim, uma considerável percentagem (quase metade dos inquiridos) prefere conversar com as pessoas, presencialmente.
A turma 10.º TAS
We are a group of students of the 10th grade of Health, as part of contents on technology and the media, we applied a survey to students on the 7th and 8th grades and of the 10th of professional courses. 65 students answered the questionnaire
1. The first question was: “On average, how much time a day do you look at your phone?
To this question, 23% of respondents answered “2 to 4 hours”; another 23% responded “more than 4 hours”; and 19% responded “30 minutes to 2 hours”.
João, Gonçalo, Diogo and Luca
2. The second question was: “How do you prefer to communicate with people?”, to which 47% responded: I prefer to talk in person; 11% responded that they prefer to talk on the phone; and 7% responded that they prefer texting.
Andreia, Clara, Maria and Mariana
3. The third question was: “What device is most important to have at home?” To this question, 35% answered: “A fridge”; 23% answered “A router/internet signal”; and 7% answered “Central heating/Air conditioning”.
Carolina Silva, Isabela and Leonor
These responses lead us to believe that, in general, students spend a lot of time focused on their cell phones and value Internet access. Still, a considerable percentage (almost half of those surveyed) prefer to talk to people in person.
The 10th TAS class
Alunos da turma 10.º TAS